Dead volume
About half of the gas does not burn. Part of every cylinder charge is just taking up space.

Ağır Sanayi ve Yapı Tesisleri
Çevre Teknolojileri & Geri Kazanım
Endüstriyel & Yapı Tesisleri
Enerji Santralleri
Kazan Sistemleri (Boilers)
Kırma ve Hazırlama
Kurutma Teknolojileri
Mühendislik & Taahhüt Hizmetleri
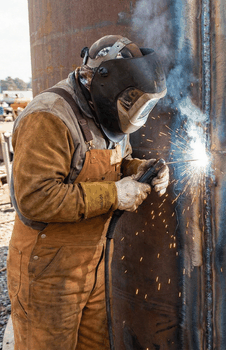
More energy from the same gas.
Roughly half of biogas is non-combustible CO₂, and in natural gas, LPG and LNG, moisture, inert components and composition swings erode efficiency. NEO GPR is fitted right before the consuming equipment and treats the fuel before it burns.
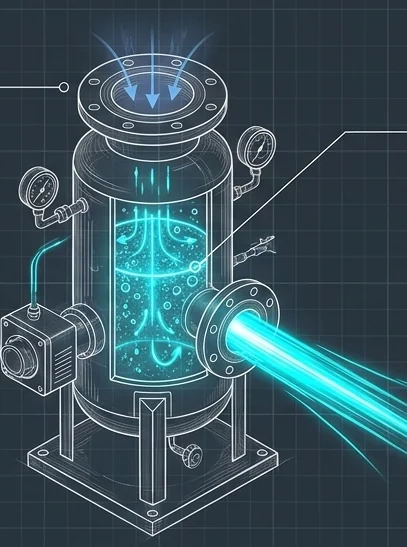
In a typical biogas, methane and carbon dioxide share the volume almost equally. Methane drives the engine; CO₂ simply takes up cylinder space, cools the flame and degrades combustion.

About half of the gas does not burn. Part of every cylinder charge is just taking up space.
Moisture in the gas absorbs heat as it evaporates, weakening the flame and cutting efficiency.
Poor combustion leads to carbon build-up, uneven burning and a risk of knock.
The problem is not your engine. It is the unburnable CO₂ in your gas.
Part of the energy never takes part in combustion, and part is wasted through poor burning.
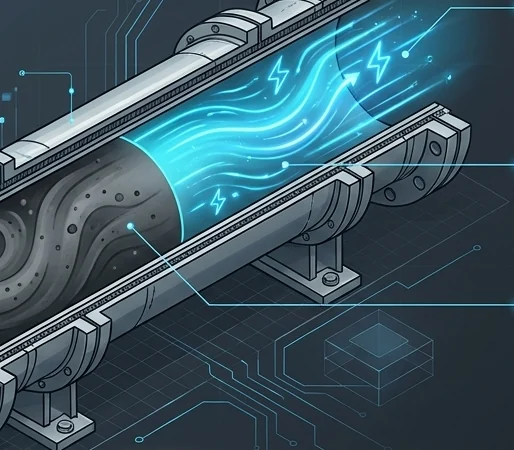
Heat drops, so more gas is burned for the same work.
Frequent, costly maintenance; oil, spark-plug and valve failures.
High CO and unburned hydrocarbon emissions.
Gas potential burned off in the flare because its quality is too low to use.
A plug-and-play fuel-line module fitted immediately upstream of the consuming equipment (engine, generator, boiler, burner).
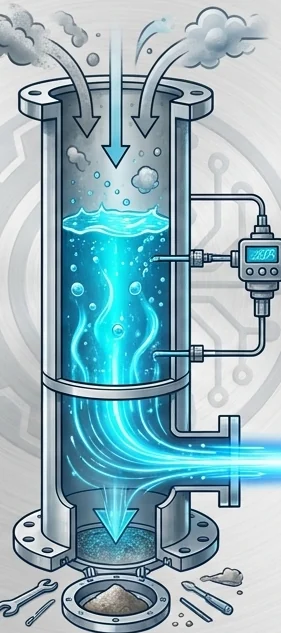
Gas passes through a line that measures, conditions and enriches it from inlet to engine. A PLC runs each stage using live analyser data.
Flow and composition (CH₄, CO₂) measured in real time.
Moisture, particulates, H₂S and siloxanes are removed.
CO₂ molecules are split at high temperature.
Water or solution vapour joins the fuel stream.
A liquid additive is dosed to improve combustion.
Gas with a higher heating value goes to the engine.
The module combination changes with the gas composition. The biggest gains come with CO₂-rich gases.
| Fuel | Current problem | Role of the NEO reactor | Target gain |
|---|---|---|---|
| Biogas / landfill gas | High CO₂ and moisture load | Treats the CO₂ and moisture load and raises energy density | 25–35% net energy gain (upper target ≈50%) |
| Natural gas | Moisture and incomplete mixing | Manages moisture and inerts for an ideal pre-combustion mix and a stable flame | Fuel saving and clean heat surfaces proven by site measurement |
| LPG | Heavy components | Prepares the fuel for combustion in the line and prevents sooting | Efficiency proven by site measurement, less maintenance |
| LNG | Cold gas and composition swings after regasification | Installed downstream of the vaporiser to even out composition swings | Stability proven by site measurement |
| Methane (mine / process) | Inert gas and CO₂ load | Separates the inert load and turns waste gas into fuel | Full-capacity use of the waste gas |
All figures are verified per project against site conditions and gas analysis.



Manages inert components so the same heat or steam takes less gas.
Used in: ceramic kilns, textile stenters, steam boilers.

Prepares heavy components for combustion. Safety note: dedicated ventilation is engineered against gas pooling at floor level.
Used in: micro-grids, islands, isolated site generators.
Installed downstream of the vaporiser to damp cold-gas shocks and composition changes.
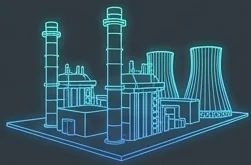
Used in: combined-cycle plants, steel and glass furnaces.
Current electrical output of a biogas engine and the extra power targeted with a 25–35% efficiency gain.
With less knock and carbon build-up, oil, spark-plug and valve change intervals stretch out markedly.
Unplanned stops are avoided and annual running hours go up.
Current outputs assume roughly 1.9 kWe per m³/h of biogas. The actual figure depends on methane content and engine efficiency.
For a plant with 4,000,000 kWh of fuel energy a year, today’s annual value is TRY 7,513,043 on a natural-gas-equivalent basis.
+1,000,000 kWh extra energy
+1,200,000 kWh extra energy
+1,400,000 kWh extra energy
Model basis: 100 m³/h × 8,000 h/yr × 5.0 kWh/m³ = 4,000,000 kWh/yr of fuel energy; natural-gas-equivalent unit price ≈ TRY 1.88/kWh. Gains are verified independently by gas analysis and flow measurement under the same conditions before and after the reactor is commissioned.
For guidance only. Heating value is typically 5–6.5 kWh/m³ for biogas and ≈9.5–10.5 kWh/m³ for natural gas. Extra electrical power is estimated at 1.9 kWe per m³/h; firm figures come from site measurement.
Running a biogas plant? Enter your gas flow and CH₄ content to see the estimated additional methane, energy and CO₂ benefit on a separate page.
Biogas yield calculatorMore electricity and power from the same gas volume. The upper target is around 50%.
NEO additives prevent uneven combustion so the engine can run at full capacity without knock.
Carbon build-up on pistons and cylinders stops, extending service intervals and cutting maintenance costs.
Fits into your existing fuel line. No engine, boiler or burner changes.
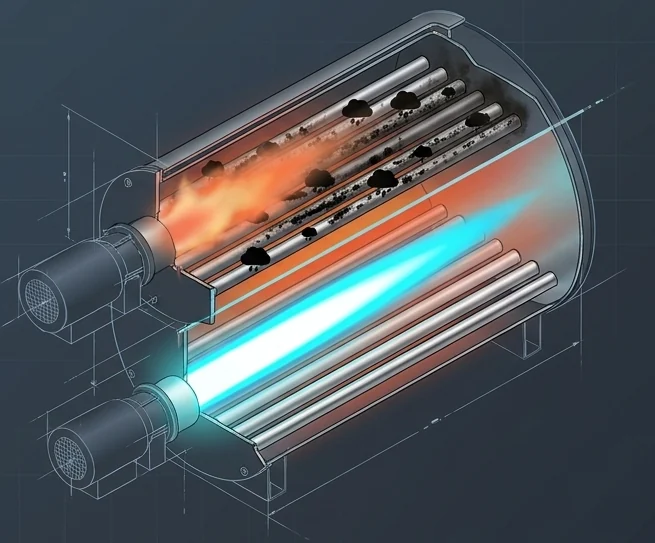
Target applications: food & beverage steam boilers, ceramic kilns, textile thermal-oil boilers, asphalt plants.
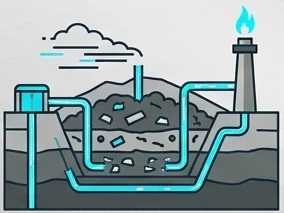
Evens out sharp swings in gas quality and prevents engine trips.
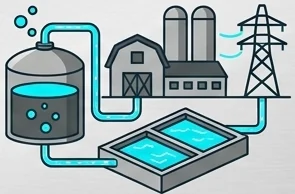
Recovers gas that would be flared for poor quality and turns it into electricity.
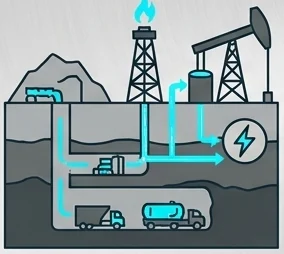
Puts mine methane and flare gas that would be vented to work generating electricity.

Raises fuel efficiency on isolated LPG/LNG gensets and cuts logistics costs.
| Technology class | CO₂ splitting + hydrogenation (modular closed loop) |
|---|---|
| Compatible fuels | Biogas, landfill gas, methane, natural gas, LPG, LNG |
| Power consumption | 50–100 W (ultra-low input power) |
| Discharge chamber temperature | 3,000–6,000 °C (point plasma) |
| Reaction products | Carbon monoxide (CO) and oxygen (O₂) |
| Body | Welded stainless-steel pressure cylinder; bolted, gasketed flanges; resistant to H₂S and moisture |
| Moving parts | No rotating parts; one pump and one level sensor |
| Fittings | TS EN 331 gas ball valves and check valves |
| Automation | Closed-loop PLC — integrated CO₂, O₂, CH₄ gas analyser and flow meter |
| Size & capacity | Fully project-specific (sized by m³/h flow and site demand) |
| Process additives | Ionic solution + NEO combustion additives |
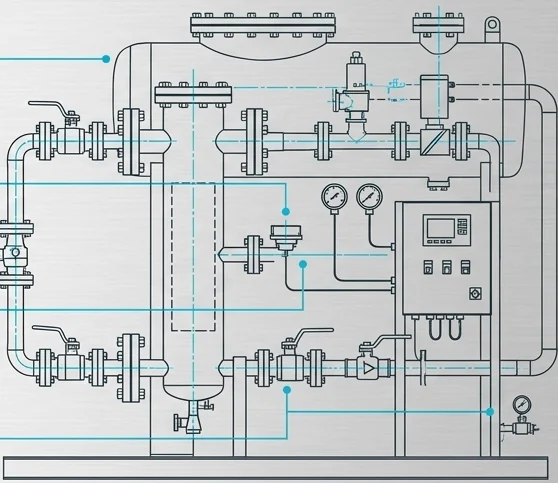
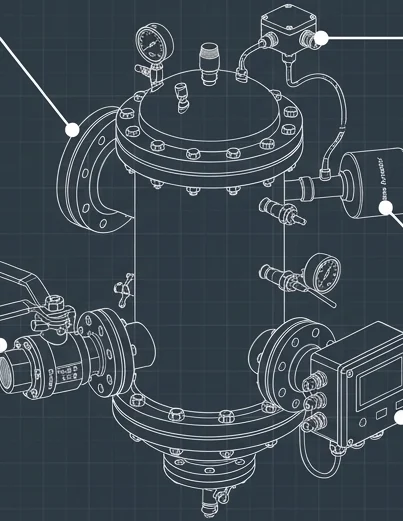
When a process produces CO and O₂, safety comes first in the design: as few moving parts as possible, and every protection layer tied into the PLC.
Directives and standards used as the design basis.
Project integration in eight steps, with one point of contact from survey to periodic service.
On-site gas analysis (CH₄, CO₂, H₂S, moisture), flow measurement and a review of equipment capacity.
A transparent, site-specific energy-gain and payback (ROI) report.
Module sizing for your flow and an engineering compatibility report.
Fabrication and pressure testing in NEO Makina workshops.
Direct tie-in to the fuel line just before the consuming equipment, with minimum downtime.
ATEX functions are tested and the system is handed over.
Power, fuel use and exhaust analyses before and after installation are reported side by side.
Solution monitoring, bottom-flange servicing and performance checks.
One reactor for every gas fuel. Talk to our engineers about a free site survey and a preliminary energy-gain estimate for your plant.